Anyone who manages a fleet of Comrex contribution codecs will know the problem. You have ACCESS MultiRack units in a broadcast centre, BRIC-Link devices at remote sites, ACCESS Portable NX units in the field - and keeping track of which ones are online, which are connected, and which have silently gone offline is a constant background task. Checking them individually through Switchboard is fine for one or two units. At scale it becomes friction.
I built the Comrex Fleet Dashboard to solve this. It is a lightweight Node.js application that polls the Comrex Switchboard API and presents the status of your entire codec fleet in a single, auto-refreshing view.
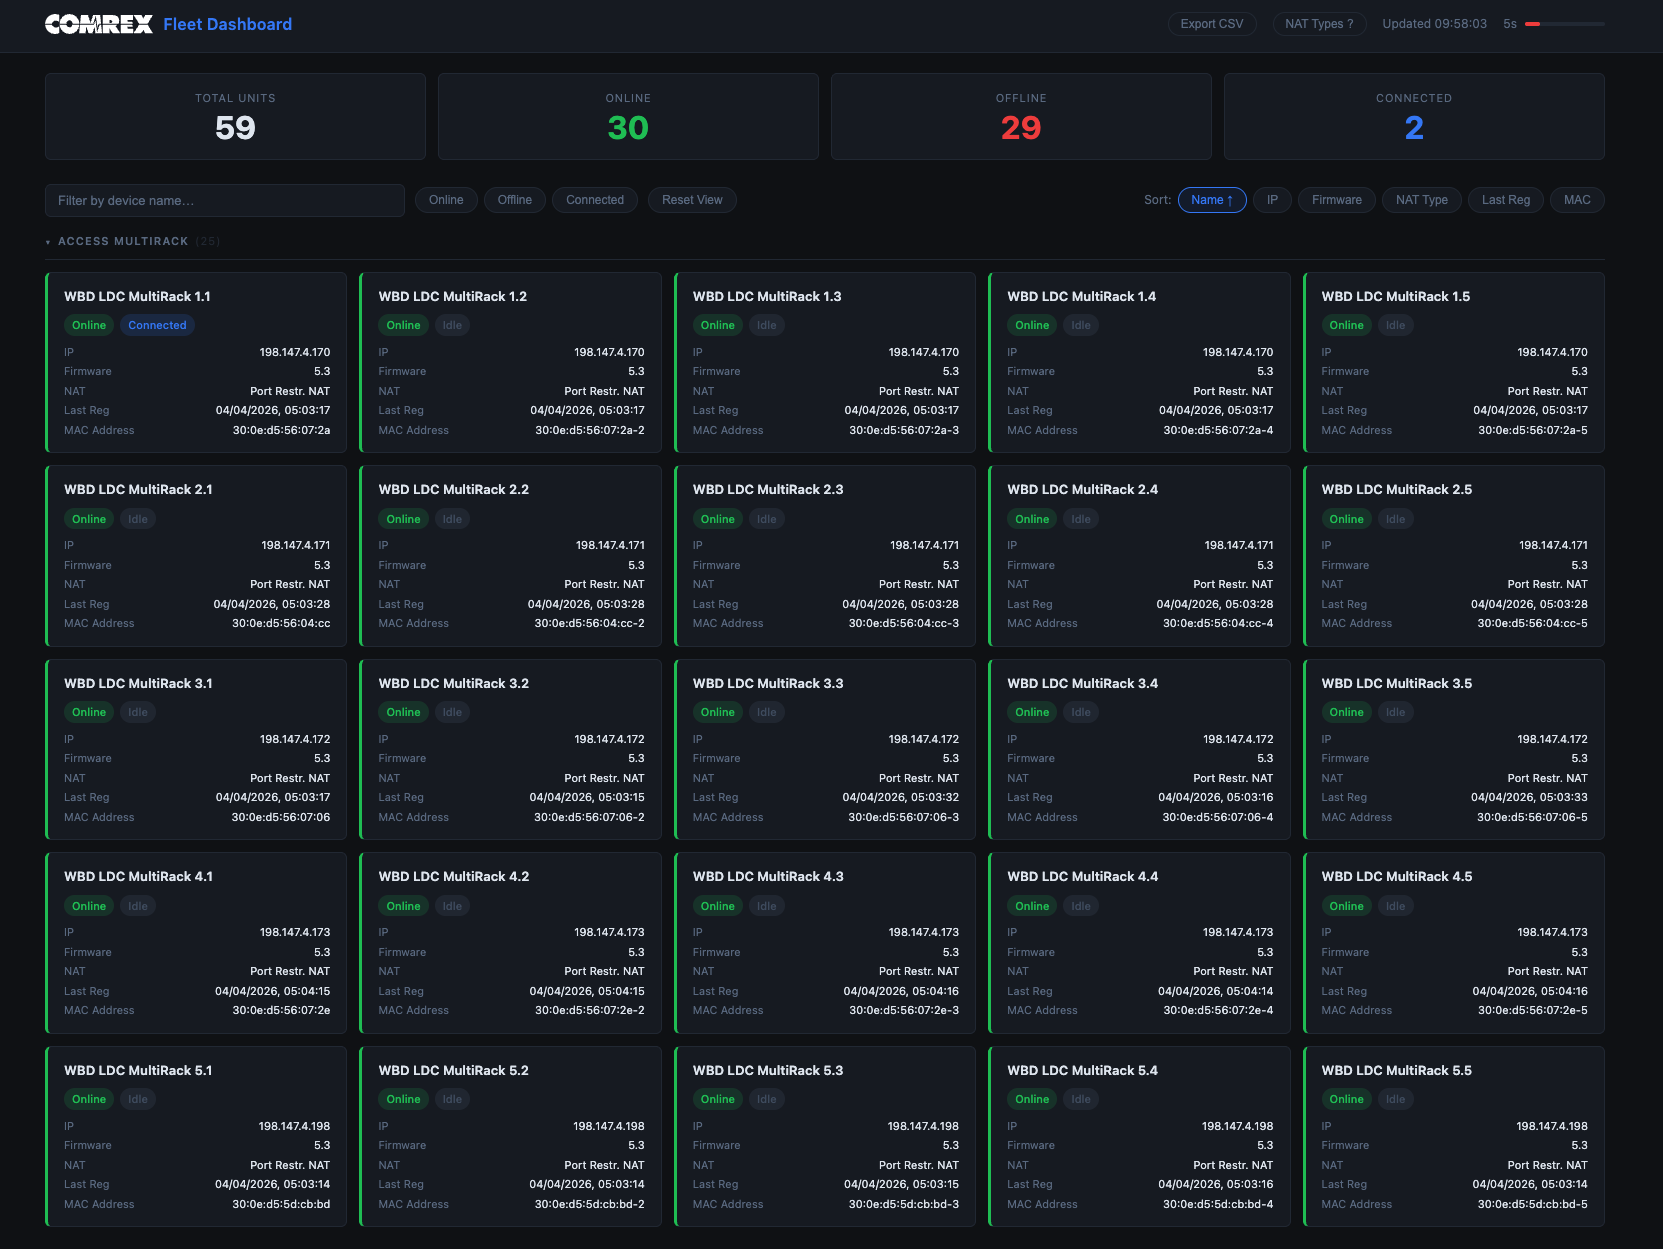
What It Does
The dashboard gives you a single page showing every Comrex unit registered to your Switchboard account. For each device you can see:
- Registration status - whether the unit is online, offline, or in a secure state
- Connection status - connected to a remote end, or idle
- IP address and NAT type - clicking the NAT type opens a modal with an explanation of what it means and its implications for connectivity
- Firmware version
- Last registration timestamp
Units are grouped automatically by device type - ACCESS MultiRack, BRIC-Link, ACCESS Portable NX - with collapsible sections and a device count per group. A summary bar at the top shows totals: how many units are online, offline, and currently connected.
Column headers are sortable - click any column to sort the fleet by that field, with a second click to reverse the order. This is useful for quickly spotting outliers, such as units running old firmware or those that have not registered recently.
There is a search field for filtering by device name, which is useful when you have a large fleet and need to find a specific unit quickly. The page refreshes automatically every 30 seconds, with a visible countdown timer so you know exactly how stale the data is.
The table can be exported to CSV with a single button, giving you a snapshot of the current fleet state that you can drop into a spreadsheet or share with colleagues.
How It Works
The architecture is deliberately simple. A small Express server acts as a proxy between the browser and the Comrex Switchboard API. The browser cannot call the Switchboard API directly due to CORS restrictions, so the server handles authentication and forwards the response.
The server applies a 29-second in-memory cache to the API response. This means all browser tabs - and all users on the same instance - share a single upstream API request per refresh cycle, which keeps usage within rate limits without any coordination overhead. There is no database, no persistent storage, no authentication layer. You run it on a local machine or internal server, access it through a browser, and it just works.
Configuration is a single environment variable - your Comrex Switchboard API token. The server binds to localhost only, so it is straightforward to expose internally via a reverse proxy if you want it accessible across your network.
Why I Built It
On larger events and multi-site operations, codec status is something you want visible at a glance - ideally on a monitoring screen alongside other operational dashboards. Switchboard is fine as a management interface, but it is not built for at-a-glance fleet monitoring. The dashboard fills that gap without requiring any changes to how the codecs are managed.
It is also useful as a pre-show check. A quick look at the dashboard before a broadcast starts tells you immediately if any unit has gone offline or is not showing as connected when it should be.
A Note on Security
The dashboard is designed for use on a trusted internal network. If you are considering exposing it on the public internet, there are a few things worth keeping in mind.
The application has no built-in authentication layer. Your Switchboard API token is held in server memory and never sent to the browser, but anyone who can reach the server can view your fleet data. If you expose it publicly, put it behind a reverse proxy that enforces authentication - HTTP basic auth via nginx is the simplest option, but any authentication mechanism your proxy supports will work.
HTTPS is also essential for public-facing deployment. Without it, credentials passed to a basic auth prompt are sent in plaintext. Most reverse proxy setups handle TLS termination, so this is usually handled in the same step.
Finally, consider whether public exposure is necessary at all. A VPN or SSH tunnel gives you access from anywhere without exposing the service to the open internet. For most broadcast use cases, that is the better trade-off.
Getting Started
git clone https://github.com/prattledev/comrex-dashboard
cd comrex-dashboard
npm install
cp .env.example .env
# Add your Comrex Switchboard API token to .env
npm start
Then open http://localhost:3000 in a browser. The dashboard begins polling immediately.
The source is on GitHub and is MIT licensed. If you manage a fleet of Comrex units and find it useful, or have suggestions for what else it should show, feel free to open an issue or contribute.